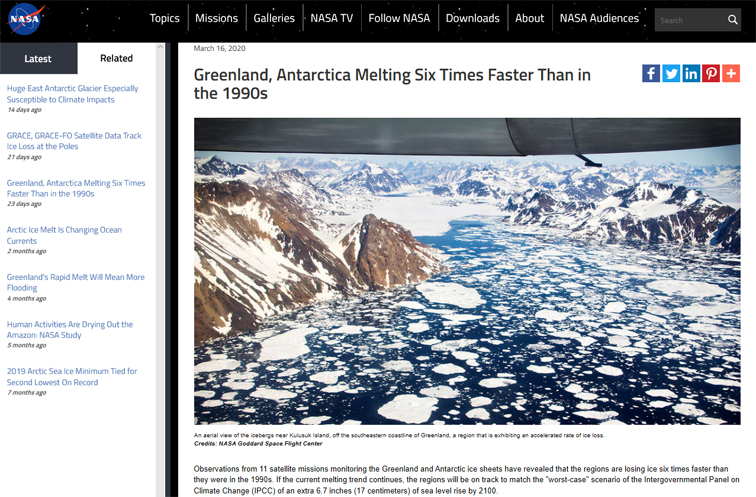
An aerial view of the icebergs near Kulusuk Island, off the southeastern coastline of Greenland, a region that is exhibiting an accelerated rate of ice loss.
Credits: NASA Goddard Space Flight Center
Observations from 11 satellite missions monitoring the Greenland and Antarctic ice sheets have revealed that the regions are losing ice six times faster than they were in the 1990s. If the current melting trend continues, the regions will be on track to match the "worst-case" scenario of the Intergovernmental Panel on Climate Change (IPCC) of an extra 6.7 inches (17 centimeters) of sea level rise by 2100.
The findings, published online March 12 in the journal Nature from an international team of 89 polar scientists from 50 organizations, are the most comprehensive assessment to date of the changing ice sheets. The Ice Sheet Mass Balance Intercomparison Exercise team combined 26 surveys to calculate changes in the mass of the Greenland and Antarctic ice sheets between 1992 and 2018.
The assessment was supported by NASA and the European Space Agency. The surveys used measurements from satellites including NASA's Ice, Cloud, and land Elevation Satellite and the joint NASA-German Aerospace Center Gravity Recovery and Climate Experiment. Andrew Shepherd at the University of Leeds in England and Erik Ivins at NASA's Jet Propulsion Laboratory in Southern California led the study.
The team calculated that the two ice sheets together lost 81 billion tons per year in the 1990s, compared with 475 billion tons of ice per year in the 2010s — a sixfold increase. All total, Greenland and Antarctica have lost 6.4 trillion tons of ice since the 1990s.
The resulting meltwater boosted global sea levels by 0.7 inches (17.8 millimeters). Together, the melting polar ice sheets are responsible for a third of all sea level rise. Of this total sea level rise, 60% resulted from Greenland's ice loss and 40% resulted from Antarctica's.
"Satellite observations of polar ice are essential for monitoring and predicting how climate change could affect ice losses and sea level rise," said Ivins. "While computer simulations allow us to make projections from climate change scenarios, the satellite measurements provide prima facie, rather irrefutable, evidence."
The IPCC in its Fifth Assessment Report issued in 2014 predicted global sea levels would rise 28 inches (71 centimeters) by 2100. The Ice Sheet Mass Balance Intercomparison Exercise team's studies show that ice loss from Antarctica and Greenland tracks with the IPCC's worst-case scenario.
Combined losses from both ice sheets peaked at 552 billion tons per year in 2010 and averaged 475 billion tons per year for the remainder of the decade. The peak loss coincided with several years of intense surface melting in Greenland, and last summer's Arctic heat wave means that 2019 will likely set a new record for polar ice sheet loss, but further analysis is needed. IPCC projections indicate the resulting sea level rise could put 400 million people at risk of annual coastal flooding by the end of the century.
"Every centimeter of sea level rise leads to coastal flooding and coastal erosion, disrupting people’s lives around the planet," said Shepherd.
As to what is leading to the ice loss, Antarctica's outlet glaciers are being melted by the ocean, which causes them to speed up. Whereas this accounts for the majority of Antarctica's ice loss, it accounts for half of Greenland's ice loss; the rest is caused by rising air temperatures melting the surface of its ice sheet.
For more information about the Ice Sheet Mass Balance Intercomparison Exercise, visit: http://imbie.org/
